10 Reasons to Get Started With Sage Intelligence
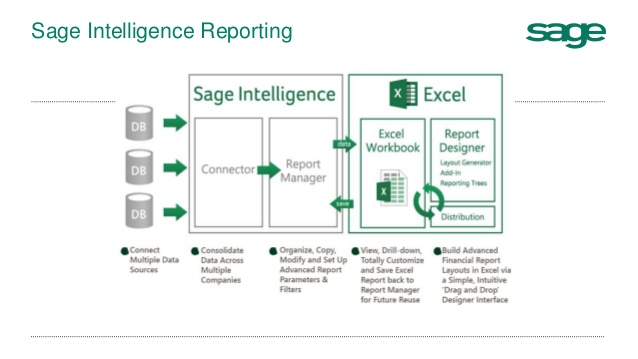
Sage Intelligence is a reporting solution embedded within your Sage product that helps surface the right data to improve business decisions. The nice thing about Sage Intelligence is its ability to connect to multiple data sources, including Sage CRM and Sage 300 ERP, and present that data to operations, financial and executive audiences. In this post you’ll learn about how Sage Intelligence works and see some inspiring real-life examples of how to use the tool.
Who is Sage Intelligence For?
Working directly with Sage Intelligence is especially attractive to people with accounting and financial roles who have already developed strong Excel skills and feel comfortable manipulating data in Excel. Because the Sage Intelligence reports have so many templates, it’s possible to adjust these to meet the specific needs of your business. The template reports have embedded parameters so that you can filter the data based only on what you want to see.
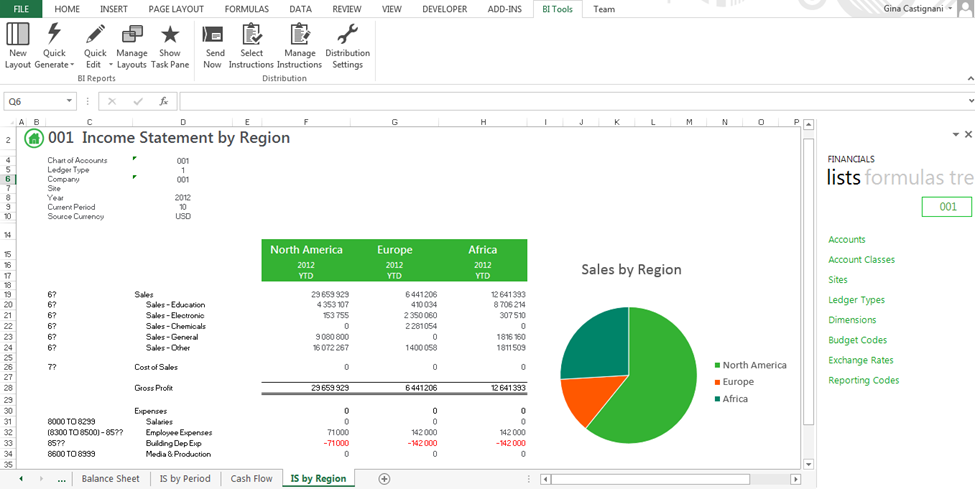
But even if you don’t have experience with pivot tables and other advanced Excel functionality, you can easily run and view reports to show you what you need to see. You don’t have to be an Excel power user to run a Sage Intelligence report or collaborate with the team at DataQuest to generate a custom report that gives you what you need to see. Here’s a sample income statement built from a template:
10 Inspiring Examples of real Sage Intelligence Reports that DataQuest customers are using
- This month to date Salary & Wages Actual vs Budgets
- CRM Opportunities, forecasts and performance by salesperson
- Inter Entity Balancing Report
- A list of Inventory with status values that is sent to users and also used by product website
- A combined list across all entities for vendor activity
- Number of support calls taken and replacement products sent per employee in a pie chart
- Growth rate month over month per customer segment relative to previous year
- Sales for all customers who started with us in this month and who is responsible
- MTD and YTD sales, excluding Freight, as a % of budget
- A daily audit across integrated systems (ERP, Warehouse Management, and Sales Analysis databases) to make sure all revenue is captured
Spotlight: Mather Lifeways
“We created a budget-to-actual variance report for our entire Chart of Accounts across all of our operating units. Because Sage Business Intelligence does all the “heavy lifting” for us, we can use some basic Excel formulas and formatting to immediately identify critical variances and trends at any moment, any day of the week, at the touch of a button. This allows us to monitor, and react to, our business in real-time.”
– Will Pokin, Mather LifeWays
The Mather LifeWays team has created an elegant solution for reporting across their entire business. For example, they created a master control tab in every workbook which allows the user to choose from dynamic parameters which are then applied to all other worksheets within the workbook. The reports often include pivots and slicers, giving people the ability to see a high level view of the data on one tab and detailed level on another. The team has also used Excel VBA to make it easy to do things like copy/paste, suppress any zeros, and enhance data manipulation.
Spotlight: McCloud Services
The team at McCloud Services has used Sage Intelligence to auto-deliver highly detailed information about Sales Opportunities and communications to help motivate and inspire salespeople to advance the opportunity pipeline. The business development manager sees the entire sales team’s activity, showing the big picture view of all the accounts and their status. The manager’s report also creates healthy competition among the team.
“We’re using Sage Intelligence for pipeline management for the sales team. They are primarily hunters- their pipeline can get pretty big, and this report helps them stay focused on the right opportunities. It helps keep all their opportunities in front of them, remind them to update the status, or to follow up with the opportunity contacts. Every salesperson using CRM gets this report.”
-Mahi Kokkinos, McCloud Services
Further Resources For Sage Intelligence
There are five modules of Sage Intelligence Reporting: Report Manager, Report Viewer, Connector, Security Manager and License Manager.
Report Manager : The Report Manager provides an interface to create, run and modify reports.
Report Viewer : The Report Viewer is a space to run reports on the fly.
Report Designer : The Report Designer gives you options to build and modify reports- either using a drag and drop graphical interface with the Layout Designer, or by using the Task Pane, which is intended for more experienced Excel users. Here you’ll find standard reports for Financial Reports, Dashboards, Sales, and GL.
Connector : The connector maintains connections to the data sources used in Sage Intelligence and other ODBC-compliant data sources.
Security Manager : Security Manager gives you a place to control access to reports by Sage 300 ERP User.
License Manager: The License Manager allows you to see your module licensing for the product.
You can email your Sage Intelligence report, save it to an FTP site, or save in various formats. For more information on Sage Intelligence, give us a call or check out these helpful resources:
The Sage Intelligence Reporting Playlist