Why You’ll Choose Power BI
We’ve seen a lot of interest in Microsoft’s Power BI from our customers and wanted to share why people tend to choose Power BI for their business intelligence needs. Here’s why we think you’ll choose it as well.
We introduce Power BI on our reporting page but wanted to share a little more about how we’ve seen customers enjoy the tool and why it’s so popular.
Why People Choose Power BI
- Mobility. The Power BI designer is created with mobile, desktop and tablet versions in mind. This makes it easy for the report creator to build appropriate dashboards for the end user. And to use it, just download the Power BI app on your mobile device and you are ready to go.
- Technology. The built-in features like “quick insights” and natural language queries make you feel like you are using a robust product built for the biggest customers out there.
- Cloud. The cloud elements of Power BI are very attractive. The Power BI service is the cloud-based tool that publishes dashboards and reports to your staff people via cloud.
- Value. Microsoft made a business decision to try and attract Excel and Tableau users. So they invested deeply in the product, and then made the Power BI Desktop version free. That is a great way to get started, particularly if you have an in-house resource who can help with some of the data extraction and initial visualizations. For a larger implementation, where your entire sales team and executive staff want dashboards, Power BI Pro is available for a monthly fee per user. The pricing is competitive and it’s clear that Microsoft sees a big opportunity here to attract people to the platform. The value is excellent in both versions.
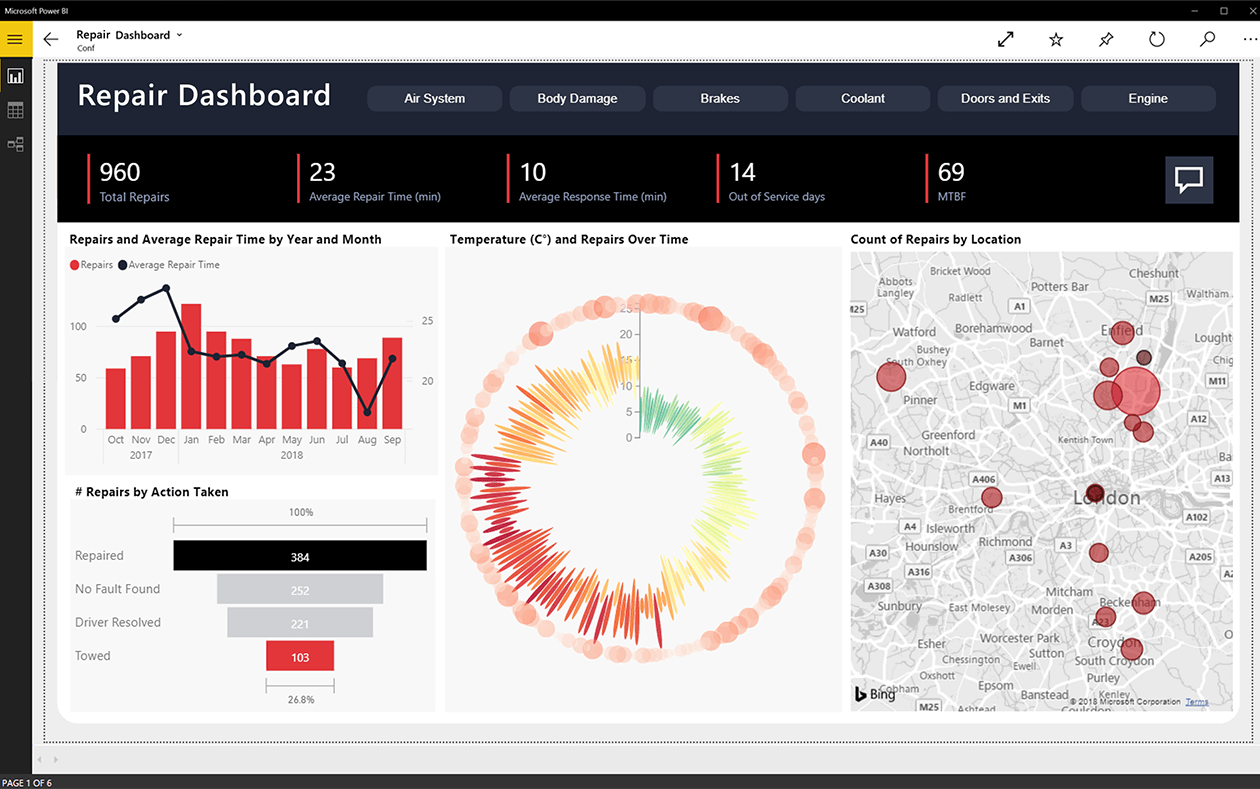
How Our Customers are Using Power BI
- Sales Data: To see trends in sales data for certain item categories over a certain period of time
- Item Profitability: To identify outliers in high-margin items and understand which geographies are the most successful
- Sales by Sales Size: Group sales into small/medium/large sizes, and see how many of each you have, by region
- Sales by Year & Month: A color-coded visualization to show sales volume for the year
We’re seeing incredible response to the Power BI reports and dashboards that we’re building. Clients like that it’s platform agnostic- so if a move to the cloud or to another platform is under consideration, Power BI can grow with you. If you agree that you may choose Power BI as a reporting tool, contact us so we can learn more about your needs.
Why Others Like Power B I
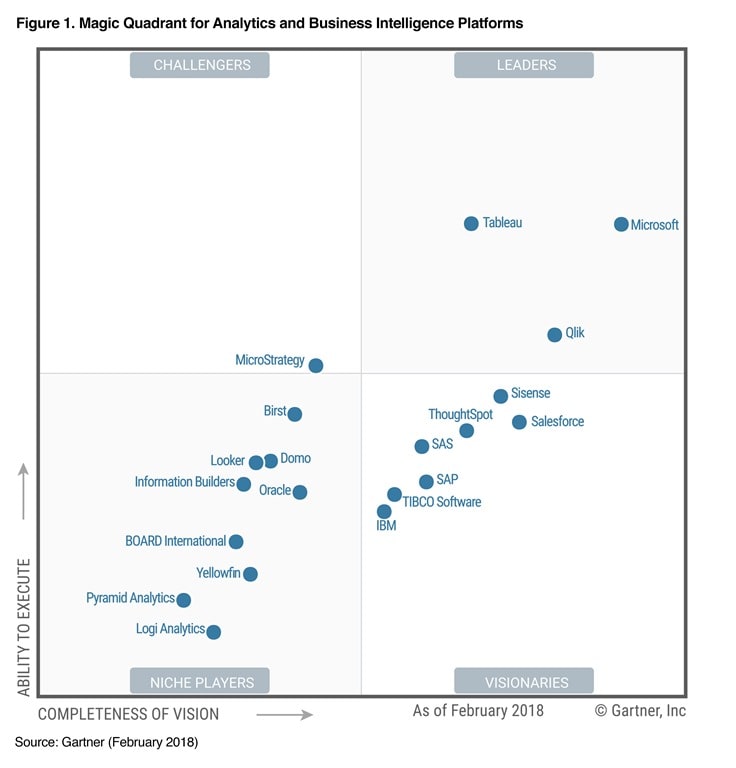
Power BI stands out for many reasons, and not just to our customers. In February 2019, Microsoft reminded us that they’ve been a leader in the Gartner Magic Quadrant for Analytics & Business Intelligence platforms for the past 12 years.
And the top organizations have chosen Power BI for good reason. One of the nice things about using a tool that is widely adopted is that the learning resources and community are robust. There are guided learning paths, online documentation areas and communities of user groups around the product. To learn more about the learning tools available, check out the “Learning Paths” on the Power BI site.